New Mexico Rapid Assessment Method (NMRAM) Lowland Riverine Wetlands Training
NMRAM Lowland Riverine Wetlands
Lowland Riverine Wetlands Field Guide Version 2.2 and worksheet packet
The New Mexico Rapid Assessment Method (NMRAM) Lowland Riverine Wetlands Field Guide provides updated procedures for conducting a rapid ecological assessment of wetlands in the Lowland Riverine Wetland subclass. The Field Guide provides specific protocols and datasheets for evaluating 14 wetland ecological condition metrics using a combination of Geographic Information System (GIS)-based measurements and field surveys. In addition to details on metric measurements, appendices are provided which include the data collection worksheets, a reference guide for taking some metric data, a plant species list with wetland indicator status, the state noxious weed list, photo point guidelines, a glossary of terms and a guide to estimating peak discharge and recurrence interval using USGS gage data.
Lowland riverine wetlands lie along fifth-order or greater streams (>1,300 cfs bankfull discharge) occurring at elevations below montane riverine wetlands (approximately below 5,500 ft) in broad alluvial valleys where the grade falls below 1%. Lowland streams may be perennial or intermittent, particularly in desert reaches or during droughts. Lowland riverine channels have a low degree of confinement from the surrounding landscape and have room for lateral movement, often leading to a high degree of channel sinuosity (Rosgen C or F channel types) or multi-channel systems (Rosgen D channel type). Lowland riverine wetlands include riparian areas and wetlands directly supported by overbank flooding, side-channel flooding, and hyporheic flow.
Training Process Overview
View the training videos in the order listed below. You should also download and have available for review the Lowland Riverine Wetlands NMRAM Field Guide Version 2.2 and worksheet packet. After watching each video it is recommended you review the relevant section of the Field Guide and practice entering test data into the associated worksheets. The relevant PowerPoint slide set for each video section is also available for download below to review while you are viewing the videos or for later reference.
- Introduction
- Landscape Metrics
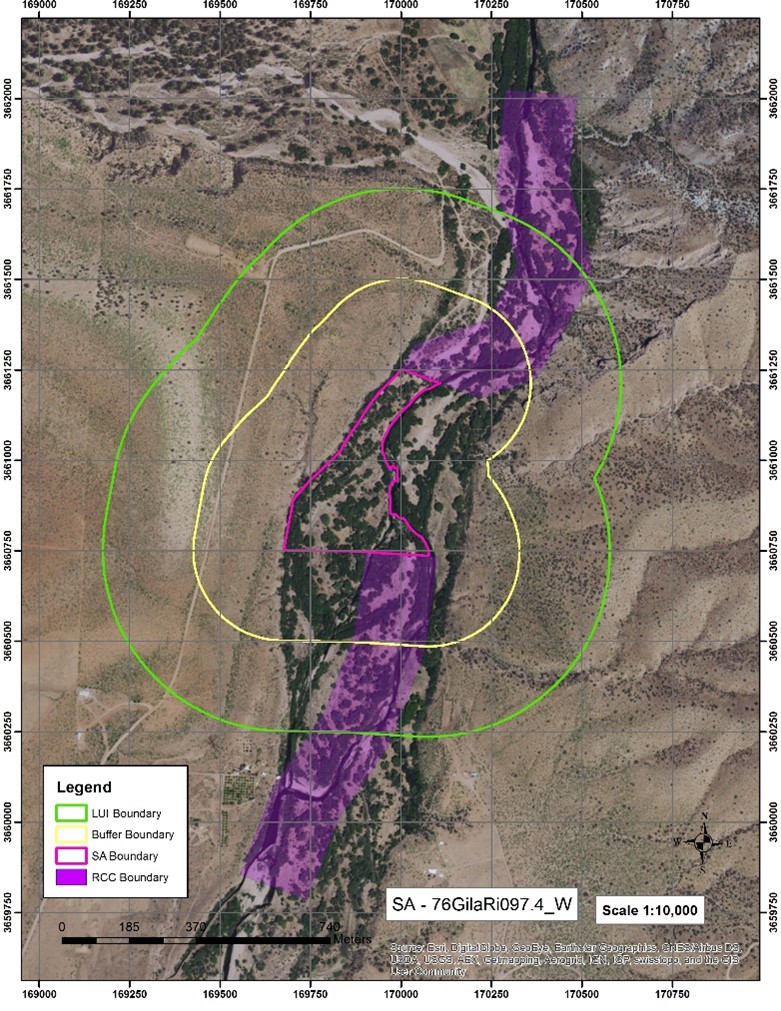
- Buffer Integrity Index (video, slides) Includes the introduction to Landscape Metrics and the Buffer Integrity Index which is a measure of the amount of natural and semi-natural vegetated buffer lateral to the SA.
- Riparian Corridor Connectivity (video, slides) Riparian Corridor Connectivity measure the disruption of natural land connectivity upstream and downstream of the SA.
- Relative Wetland Size (video, slides) Relative Wetland Size is an index of the reduction of the current wetland size relative to its estimated historical extent.
- Surrounding Land Use (video, slides) Surrounding Land Use is the amount and intensity of human land use in the Land Use Zone (LUZ) surrounding the SA.
- Biotics Metrics
- Introduction - Field Reconnaissance and Mapping (video, slides) Introduction to biotic vegetation community patch mapping and data collection for all biotic metrics on worksheets 5 and 6.
- Relative Native Plant Community Composition (video, slides) Index of the abundance of native- versus exotic-dominated vegetation communities based on data collected with SA biotic map.
- Vegetation Horizontal Patch Structure (video, slides) Assessment of general vegetation patch diversity and complexity of patch pattern based on SA biotic map.
- Vegetation Vertical Structure (video, slides) Assessment of overall vertical structural complexity of the vegetation canopy layers across the SA.
- Native Riparian Tree Regeneration (video, slides) Abundance and spatial distribution of native riparian tree regeneration across the SA.
- Invasive Exotic Plant Species Cover (video, slides) Total percent cover for the SA of invasive plant species based on New Mexico list of noxious weeds.
- Groundwater Index (video, slides) An evaluation of local water table status within the wetland that is assessed by the biotic team member although it is an abiotic metric.
- Abiotic Metrics
- Abiotic Channel and Floodplain Survey Overview (video, slides) Abiotic channel and floodplain survey used during collection of data for all Abiotic metrics.
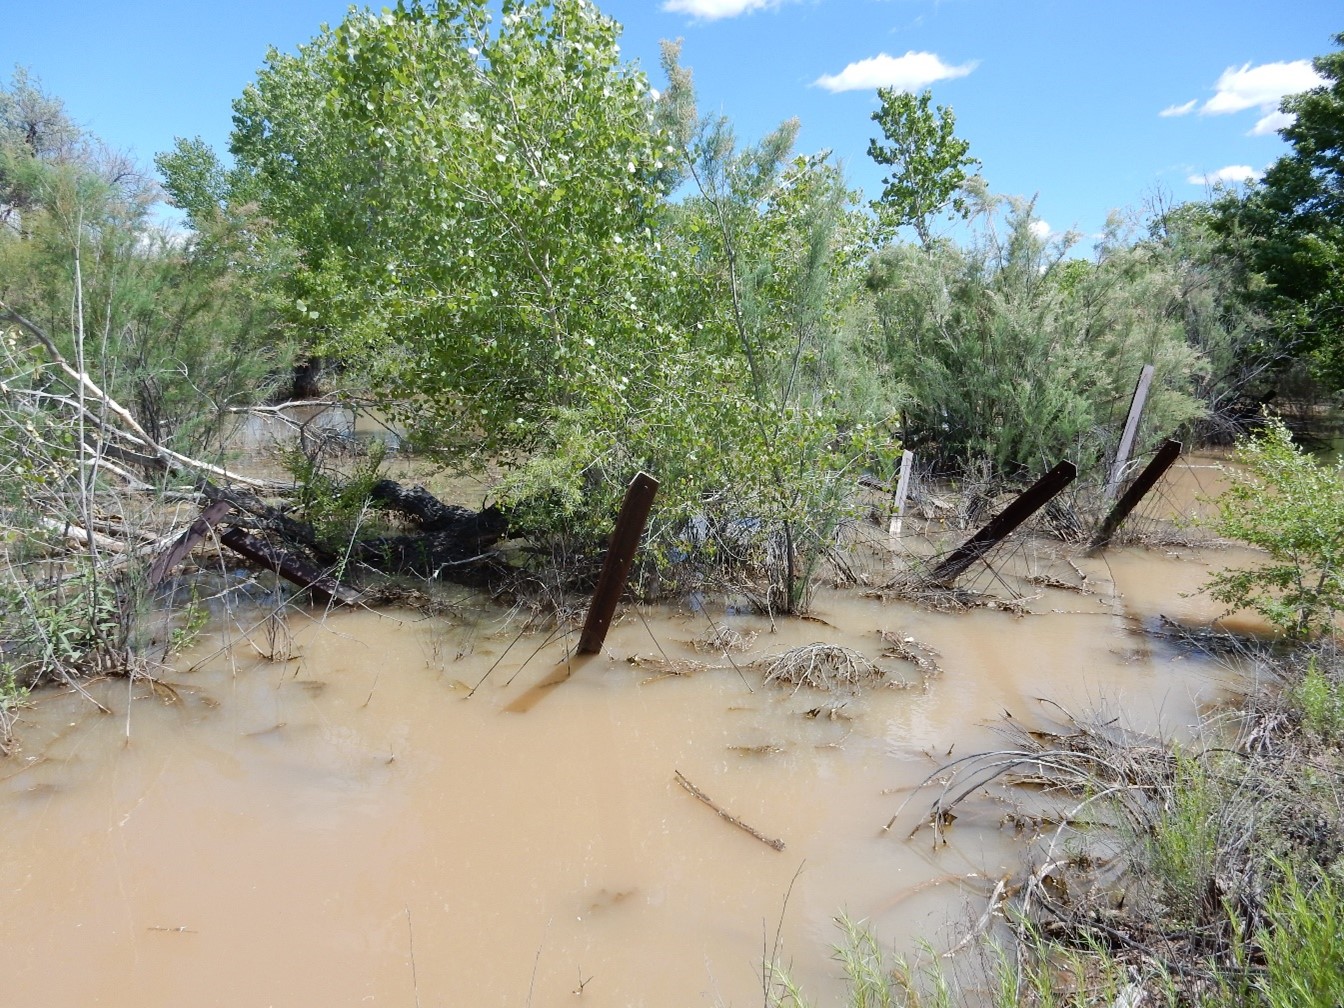
- Floodplain Hydrologic Connectivity (video 1, video 2, slides 1, slides 2) Assessment of the ability of water to flow into or out of the wetland via survey for floodplain inundation indicators. Watch Montane Floodplain Hydrologic Connectivity video introduction (video 1 above), then watch Lowland Floodplain Hydrologic video (video 2 above).
- Physical Patch Complexity (video, slides) Measure of the physical structural complexity of the SA that contributes to ecological richness.
- Soil Surface Condition (video, slides) Anthropogenic soil disturbance impacts within the SA.
- Channel Mobility (video, slides) Assessment of impediments to the dynamic capacity of the channel to laterally migrate or avulse.
- Groundwater Index (video, slides) An evaluation of local water table status within the wetland that is assessed by the biotic team member although it is an abiotic metric (if you already watched this metric video with at 3g, no need to watch again).
- Stressors and Score Roll-Up
- Stressor Checklist (video, slides) Checklist of potential drivers of ecological condition at the local watershed scale (outside of the SA) that can inform management and understanding of SA condition scores.
- SA Condition Ranking (video, slides) Final SA condition score roll-up and final ranking procedures.